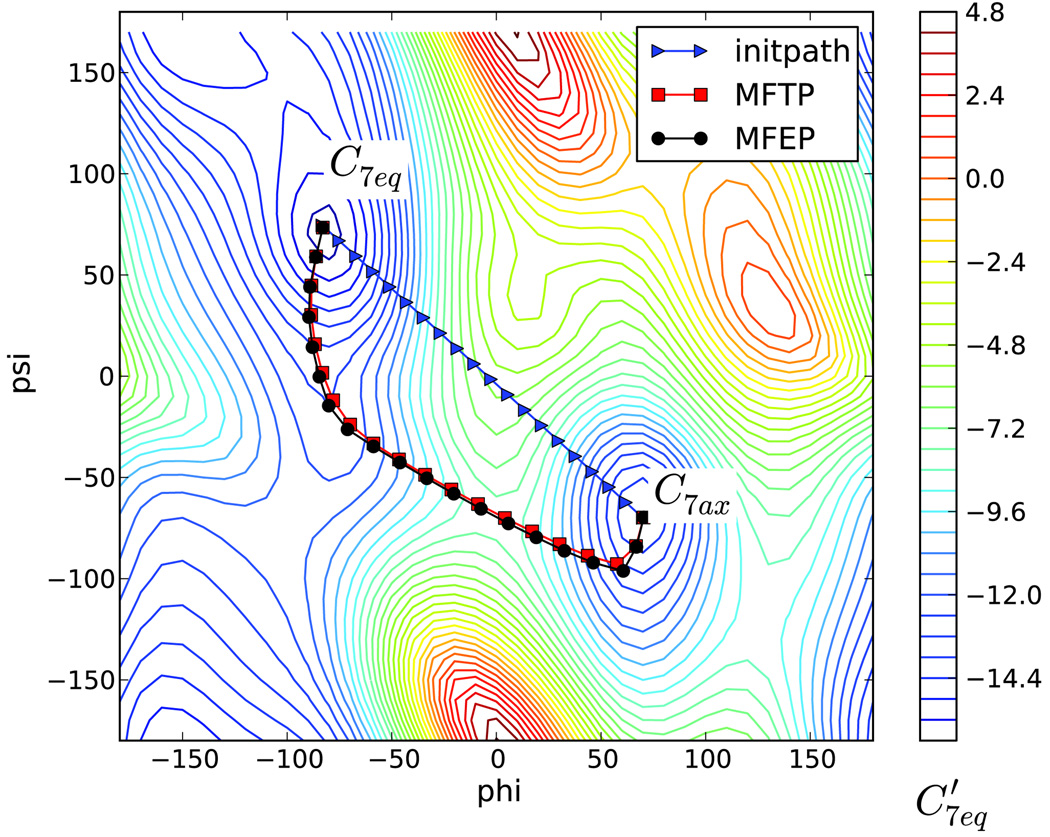
Figure 5.
Maximum flux transition path and minimum free energy path from C7eq to C7ax for alanine dipeptide in vacuum at 300 K. Triangles are images of the initial path; rectangles are the images of the maximum flux transition path; and circles are the images of the minimum free energy path. The contours are those for the zero-temperature free energy (adiabatic energy). The contour lines are separated by 0.6 kcal/mol.

