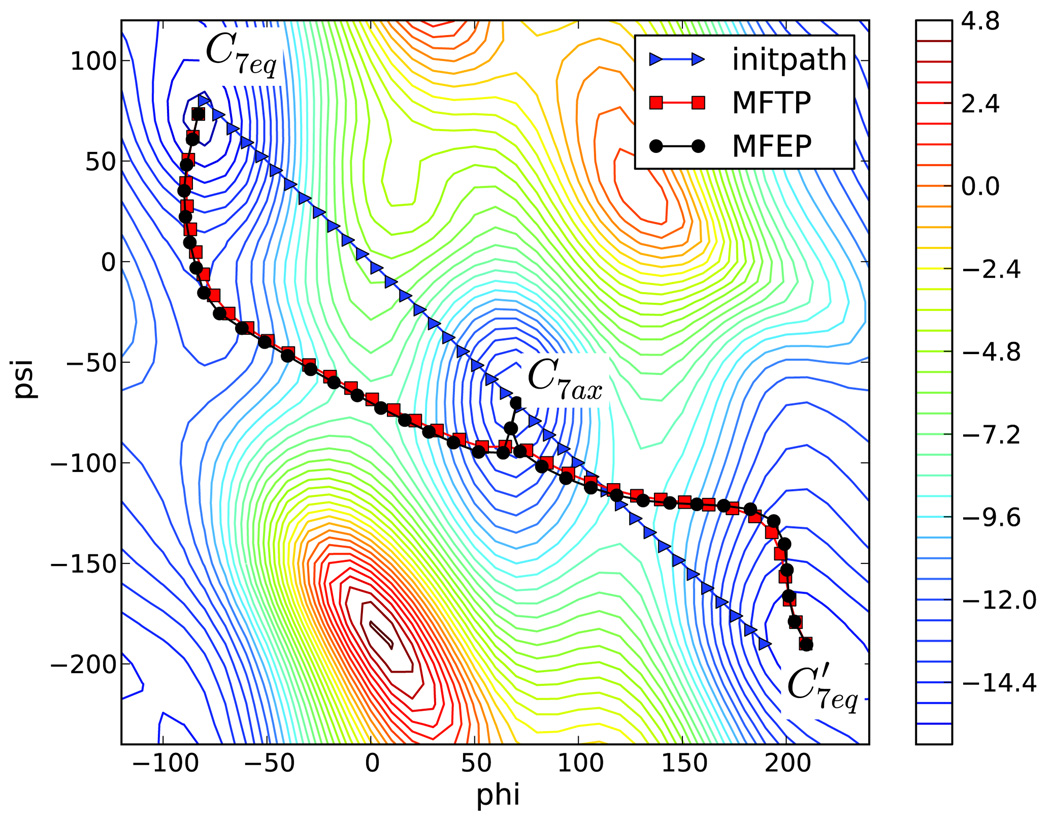
Figure 6.
Maximum flux transition path and minimum free energy path for alanine dipeptide from C7eq to passing by C7ax in vacuum at 300 K. The figure is generated using 40 images. Triangles are the images for the initial path; rectangles are the images of the maximum flux transition path; and circles are the images of the minimum free energy path. The contours are those for the zero-temperature free energy. The contour lines are separated by 0.6 kcal/mol.

