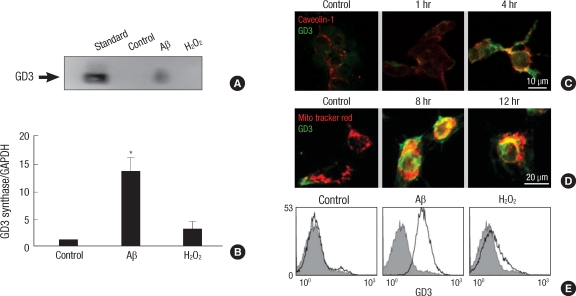
Fig. 3.
GD3 synthesis and trafficking during amyloid β-induced apoptosis. (A) TE671 cells were treated with either Aβ (40 µM) or H2O2 (0.5 mg/mL) for 16 hr. Intracellular GD3 levels were measured by thin layer chromatography immunostaining using the crude ganglioside cell extracts. (B) Expression of GD3 synthase after 4 hr of Aβ treatment was analyzed by real-time quantitative RT-PCR using GAPDH as an internal control. Results are given as the mean±S.D. of four individual experiments. *P<0.01. (C) Localization of intracellular GD3 after Aβ treatment was evaluated by double immunofluorescence staining technique with FITC-labeled anti-GD3 and Texas Red-labeled anti-caveolin-1 antibodies. (D) Cells were loaded with Mito Tracker Red for 30 min before fixation and then labeled with FITC-conjugated anti-GD3 antibody. (E) Cell surface GD3 levels after 4 hr of Aβ treatment were analyzed by flow cytometry using FITC-labeled anti-GD3 antibody.

