
Figure 2.
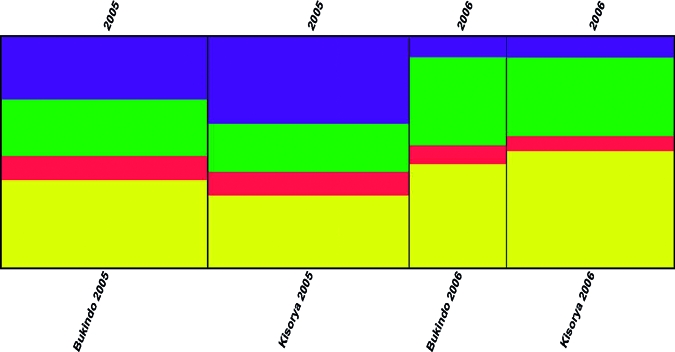
Clustering output of Schistosoma mansoni populations. A clustering output produced by distruct visualizing the outputs of data analyses from structure (a software program implementing a Bayesian clustering algorithm to determine how many putative separate populations are present in the genetic data) showing the allocation of miracidia populations by school and year to each of four putative populations. Results indicated greater diversity across all parasites at 2005 baseline (with parasites divided approximately equally between all four putative populations at k = 4, indicated by the colors blue, red, yellow and green) in comparison to the 2006 follow-up (where parasites were categorized mainly into only two, indicated by green and yellow here, of the four putative populations).