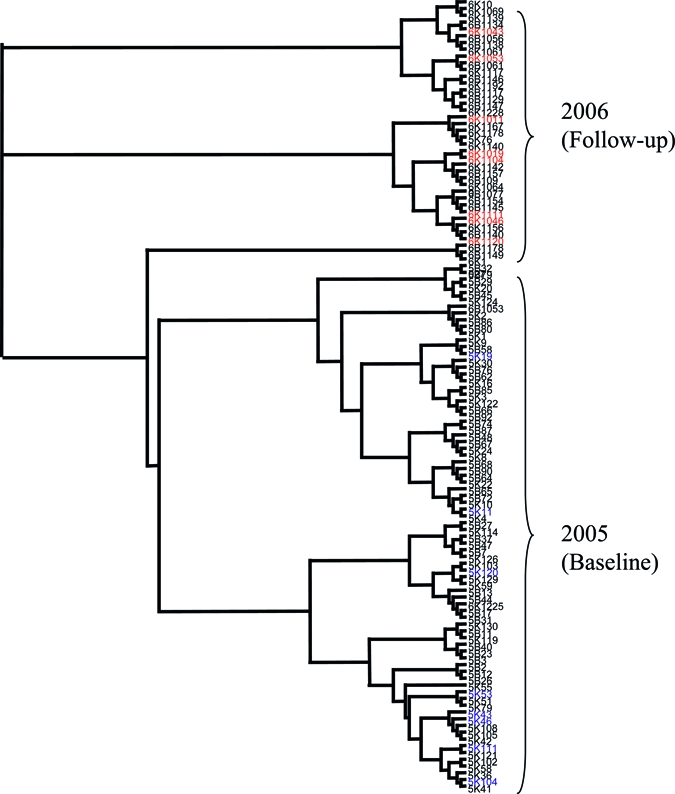
Figure 4.

Neighbor-joining tree of parasite populations per child. Neighbor-joining tree displaying genetic distance calculated using Cavalli-Sforza and Edwards' chord distances23 for all the populations of miracidia collected (from each child at each time point). Populations labeled blue and red are those parasites collected from the same child at both baseline and follow-up (blue at baseline and red at follow-up). Populations are coded by year (5 = 2005, 6 = 2006), school (B = Bukindo, K = Kisorya) and child ID number (all individuals at follow-up have “10” in front of their two digit ID number in comparison to baseline or a “1” in front of their three digit ID number in comparison to baseline).
