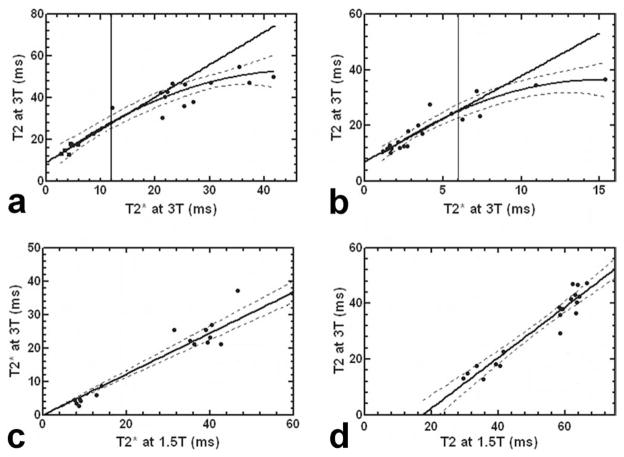
Figure 7.
a: Myocardial T2* and T2 at 3T in 18 iron overloaded patients and 2 normal subjects. b: Liver T2* versus T2 in 16 patients and 2 normal subjects. c: The 3T T2* versus 1.5T T2* in heart in 18 patients. d: The 3T T2 versus 1.5T T2 in heart in 19 patients. The dashed lines indicate the 95% limits.

