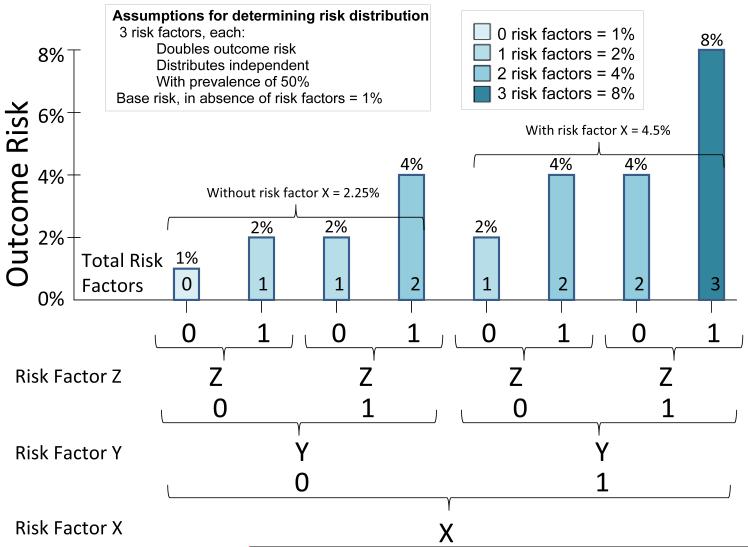
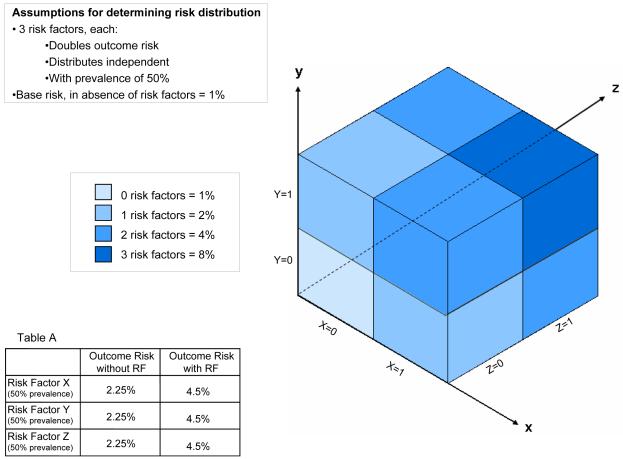
Figure 1.
The risk distribution illustrated in the figure is generated from the simple assumptions described, and averages 3.4% for the population overall (i.e. based on the arithmetic mean across the subgroups). As illustrated, any subgroup (i.e. those with risk factor X or risk factor y or risk factor z comprised of patients with any one risk factor will have an outcome-risk of 4.5%--suggesting a benefit for 7 out of 8 patients. This is true even though within any of these “high risk” subgroups, ¾ of patients have risks lower than this average. More paradoxically, the average outcome-risk for patients with any risk factor in aggregate is only 3.7%. A risk-stratified analysis, which makes use of the 3 variables simultaneously, would demonstrate that only the highest risk 1/8 of patients would benefit from therapy.


