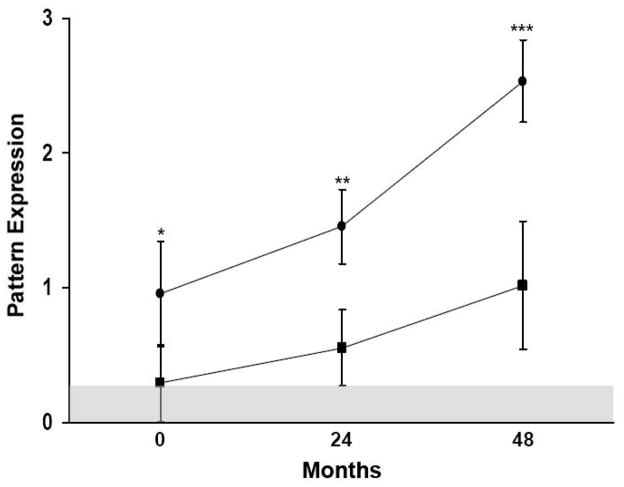
Figure 2. Longitudinal time course of positive and negative subnetwork expression.
Subject scores (mean ± SE) for the positive and negative subnetworks of the PD-related spatial covariance pattern (PDRP) (Ma et al., 2007) were separately computed in scans acquired at each time point as part of a longitudinal PD imaging study (Huang et al., 2007b). The expression of both subnetworks increased over time, but at a faster rate for the positive subnetwork. We found that patient values for the positive subnetwork were abnormally elevated at all three longitudinal time points; those for the negative subnetwork did not differ from control values at any of these time points. [Values for the positive and negative subnetworks at each time point (filled circles and squares, respectively) were displayed relative to mean values measured in 15 age-matched healthy subjects. Subject scores were z-transformed and offset so that the control mean was zero. The shaded area represents 1 SE above the control mean. *p<0.05, **p<0.001, ***p<0.0001, relative to normal values].

