
Figure 13.
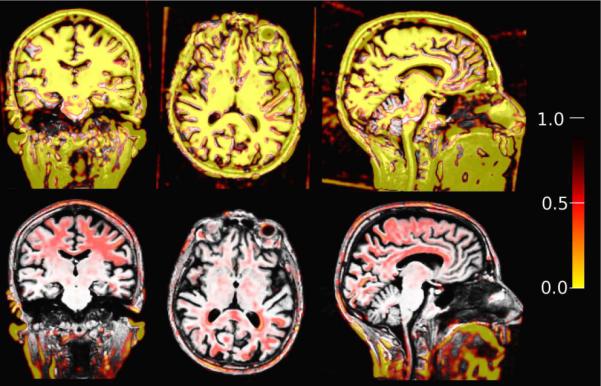
Top: Fixed low saturation of c = 4.685 (high outlier sensitivity) in a registration with intensity differences and non-linearities results in too many outlier and consequently in misalignment. Bottom: Automatic sensitivity estimation adjusts to a higher saturation value (low outlier sensitivity) to register the images successfully. The detected outlier regions are labeled red/yellow.