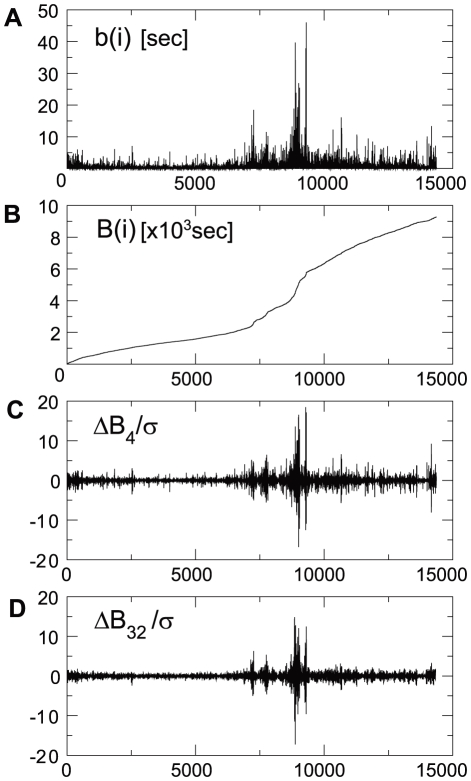
Figure 1. Illustration of the method to extract the non-Gaussianity in the ISI fluctuations.
(A) ISI's of a spike train of a neuron are displayed chronologically. (B) Cumulated ISI's. (C)(D) ISI fluctuations were calculated by detrending (defined in the text) at  (C) and
  (D). The spike train was taken from a cortical neuron #12 when the animal was awake.

