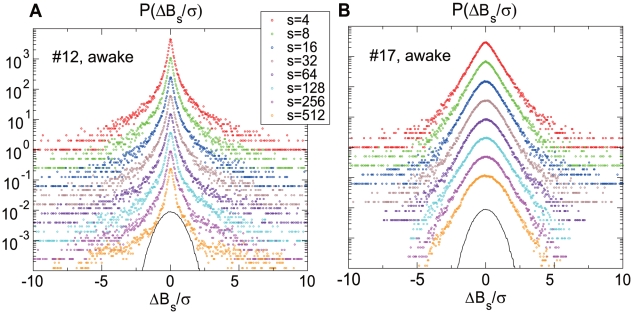
Figure 2. The probability distribution function (PDF) of the normalized ISI fluctuations.
PDFs calculated at eight different coarse graining scales are displayed for neurons indexed as #12 (A) and #17 (B). Both spike trains were taken from waking periods. The parabola representing the perfect Gaussian distribution is placed at the bottom of each panel to help readers see the degree of non-Gaussianity. The spike train from #12 is highly non-Gaussian, while that from #17 is weakly non-Gaussian.

