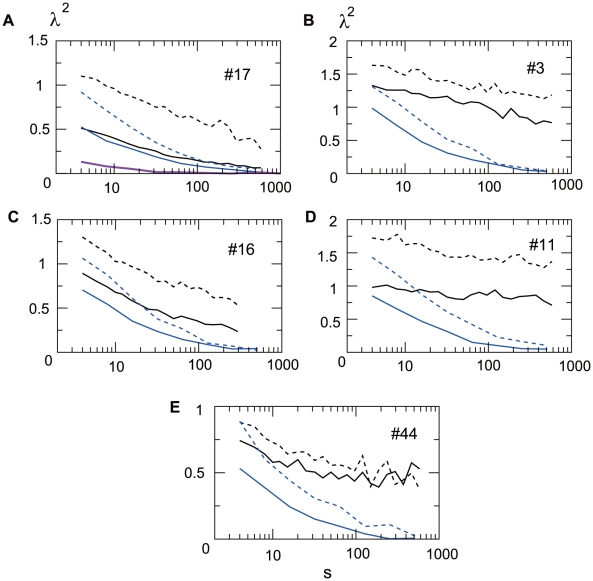
Figure 3. Scale dependence of the non-Gaussianity evaluated.
The  values that quantify the non-Gaussianity are plotted against a non-dimensional scale (number of ISI's) ranging from s = 4 to s = 582. The solid and dashed black lines represent
  values calculated from spike trains during sleeping and waking, respectively. The blue lines represent
  values calculated from spike trains of which the ISI's have been randomly shuffled. Five neurons, #17 (A), #3 (B), #16 (C), #11 (D) and #44 (E), were taken as examples. The non-Gaussianity calculated from a Poissonian spike train is shown as a reference in purple in (A). The non-dimensional maximum scale s = 1000 corresponds with the time scale through individual mean firing rates of neurons. The corresponding time scales are 120s (sleeping) and 130s (waking) for #17, 420s (sleeping) and 630s (waking) for #3, 450s (sleeping) and 590s (waking) for #16, 630s (sleeping) and 430s (waking) for #11, 500s (sleeping) and 590s (waking) for #44.

