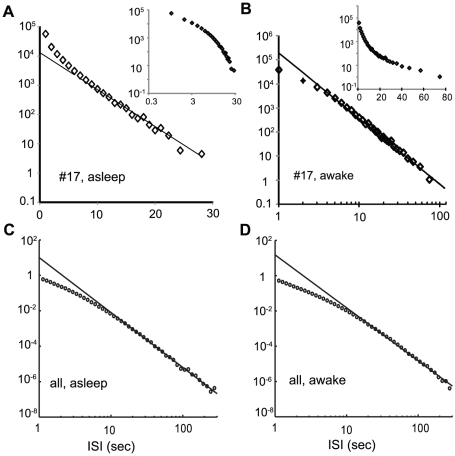
Figure 4. Tails of the ISI distributions.
Tails of the ISI distribution of neuron #17 during sleep (A) and waking (B) are plotted either in log-linear or log-log coordinates. The insets illustrate that the alternative plots (log-log in sleeping, log-linear in waking) result in a poorer linear fit in the range where the original plots exhibited a linear tendency. (C)(D) The histograms of ISI's taken during the sleeping (waking) period of all the analyzable spike trains are averaged and plotted in log-log coordinates.

