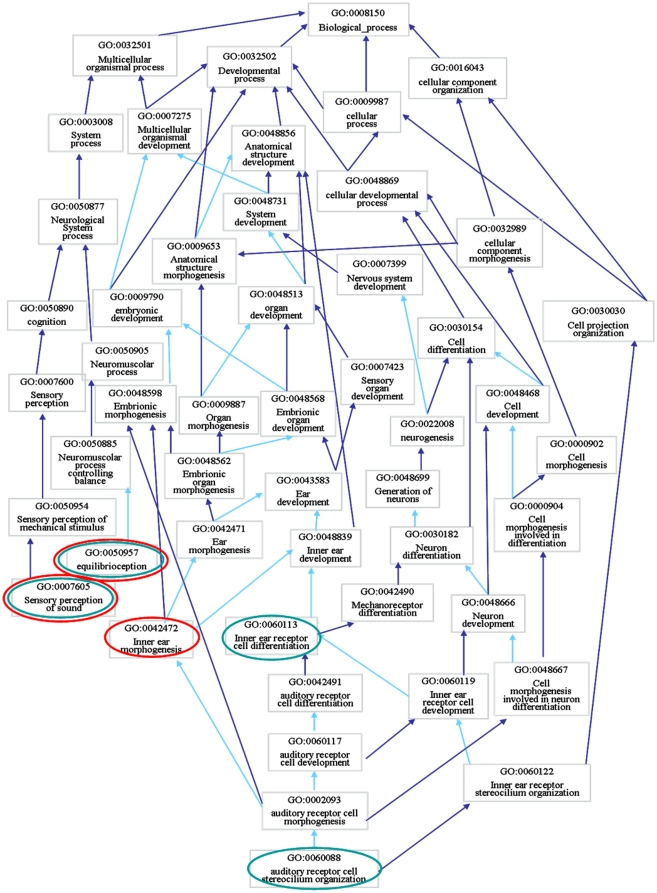
Figure 4. GO subgraph of some disease and candidate gene enriched GO terms.
Red circles indicate terms enriched for the disease genes, green circles indicate terms enriched for the candidate genes. Dark blue arrows indicate is a relations, light blue arrows indicate part of relations between the terms.

