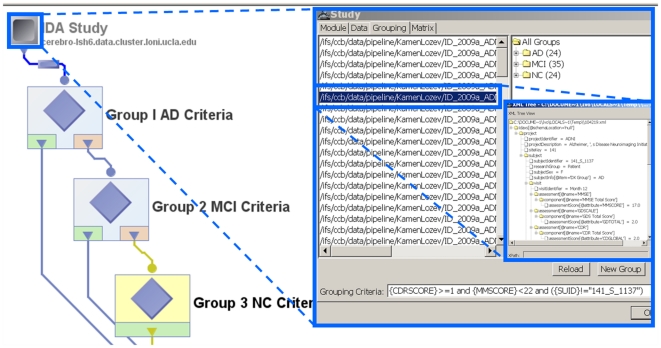
Figure 1. Pipeline Study-Design Architecture.
Imaging and non-imaging meta-data for 104 subjects is used to stratify the entire population into 3 distinct cohorts – asymptomatic normal controls (NC), Alzheimer's disease (AD) patients, and Mild Cognitive Impairment (MCI) subjects. The nested inserts show the search and selection grouping criteria, cohort sizes and an instance of an XML meta-data file for one subject. The meta-data can be manually entered, automatically parsed from spreadsheets, databases or clinical charts, or fed in as results of the pipeline workflow calculations (derived data).

