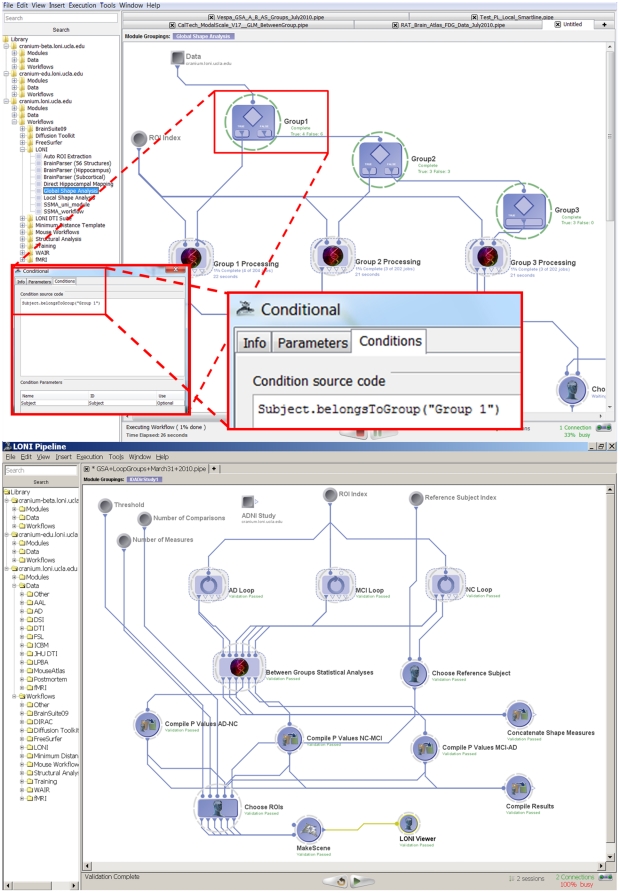
Figure 3. Pipeline environment as a visual programming language.
Top panel (Figure 3.A) shows an example of a conditional flow of control (if-else), which splits a group of subjects into 3 cohorts, processes each cohort separately and finally maps statistical differences between the 3 groups. The bottom panel (Figure 3.B) demonstrates the Global Shape Analysis (GSA) pipeline workflow with efficient loop-group iterations – see the 3 loop-group modules on the top, one for each for the 3 population cohorts (AD, MCI and NC subjects).

