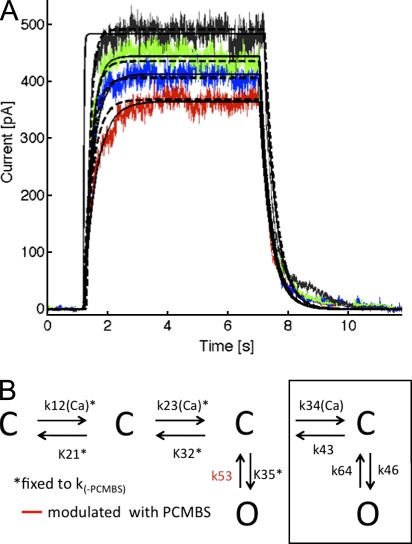
Figure 11.
PCMBS slows transition k53, as determined through the constrained version of the model. (A) Representative activation and deactivation records fit with two variations of the model. The dashed line represents the variation that allowed parameters k12, k21, k23, k32, k35, and k53 to be free, and the solid line represents the variation that held parameters k12, k21, k23, k32, and k35 to k(-PCMBS) values; k53 is the only free parameter, see Results for details. As noted in the previous figure, the Ca2+-dependent rate constants were assumed to have a nonlinear dependence on Ca2+ concentration, k = A · [Ca]/(B + [Ca]). The colors refer to the different Ca2+ concentrations, with red representing 0.5, blue 0.7, green 1.0, and black 10 μM Ca2+. (B) Gating scheme detailing that parameter k53 is modulated by PCMBS, as determined through the constrained version of the model.

