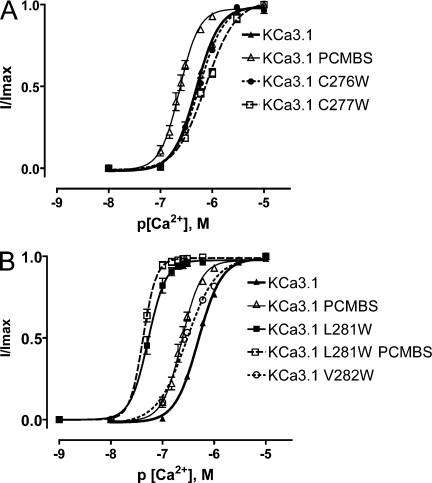
Figure 12.
Trp281 and Trp282 recapitulate the PCMBS-mediated shift in apparent Ca2+ affinity. Complete Ca2+ concentration response experiments were performed to estimate EC50 and Hill coefficients (h) for those constructs expressing macroscopic currents, as described in Fig. 3. (A) Plot of normalized 〈I〉 current against the corresponding Ca2+i for KCa3.1 C276W (•) and C277W (□). KCa3.1 (▴) and KCa3.1+PCMBS (▵) are included for comparison. KCa3.1 C276W (n = 7), EC50 = 558 ± 50 nM and h = 1.8 ± 0.1; KCa3.1 C277W (n = 6), EC50 = 748 ± 54 nM and h = 1.5 ± 0.1; KCa3.1 (n = 57), EC50 = 508 ± 13 nM and h = 2.0 ± 0.2; and KCa3.1+PCMBS (n = 6), EC50 = 235 ± 17 nM and h = 2.5 ± 0.2. (B) Plot of normalized 〈I〉 current against the corresponding [Ca2+]i for KCa3.1 L281W (■), KCa3.1 L281W+PCMBS (□), and KCa3.1 V282W (○). KCa3.1 (▴) and KCa3.1+PCMBS (▵) are included for comparison. KCa3.1 L281W (n = 12), EC50 = 54 ± 6.4 nM and h = 3.3 ± 0.2; KCa3.1 L281W+PCMBS (n = 3), EC50 = 43 ± 1.2 nM and h = 3.6 ± 0.5; KCa3.1 V282W (n = 12), EC50 = 296 ± 14 nM and h = 1.6 ± 0.1; KCa3.1 (n = 57), EC50 = 508 ± 13 nM and h = 2.0 ± 0.2; and KCa3.1+PCMBS (n = 6), EC50 = 235 ± 17 nM and h = 2.5 ± 0.2. Error bars represent standard SEM. Error bars smaller than the symbols are not visible in the graph.

