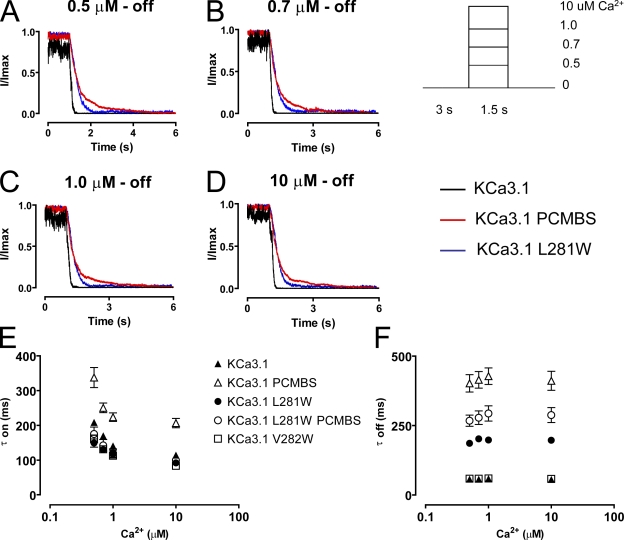
Figure 13.
Trp281 recapitulates the PCMBS-mediated modulation in deactivation kinetics. Activation and deactivation kinetics were estimated with Ca2+ jump experiments as described in Fig. 4 using Ca2+i concentrations (A) 0.5, (B) 0.7, (C) 1.0, and (D) 10 µM for L281W (blue trace) and KCa3.1 in the absence (black trace) and presence (red trace) of PCMBS, included for comparison. Activation (E) and deactivation (F) rates were estimated by fitting activation and deactivation records with an exponential function and reported as a time constant (τ-on and τ-off) for KCa3.1 (▴), KCa3.1 PCMBS (▵), L281W (•), L281W PCMBS (○), and V282W (□), see also Table I.

