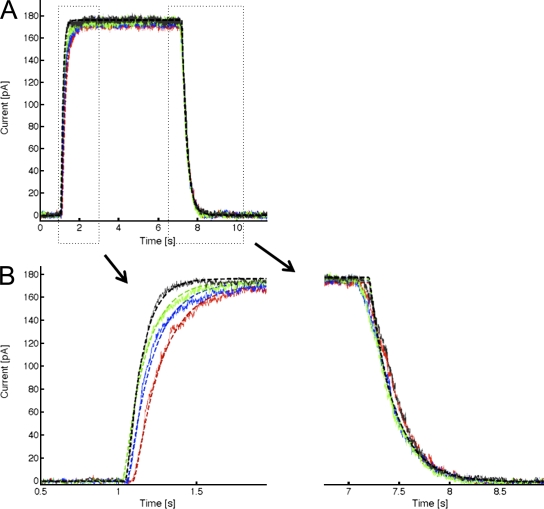
Figure 14.
A four-state model can be used to fit the activation and deactivation kinetics for KCa3.1 L281W. (A) Representative activation and deactivation records fit with the model shown in Fig. 10 A. Activation and deactivation currents were recorded and fit according to the protocol described in the Materials and methods sections. The colors refer to the different Ca2+ concentrations, with red representing 0.5, blue 0.7, green 1.0, and black 10 µM Ca2+. The dashed line represents the fit assuming Ca2+-dependent rate constants have a nonlinear dependence on Ca2+ concentration, k = A · [Ca]/(B + [Ca]). Rate constants derived from the fit are summarized in Table II. (B) Enhanced depiction of the fit outlined by the box in A.

