Figure 15.
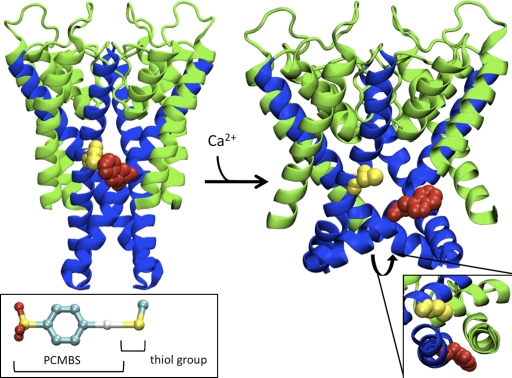
Homology model of the pore region for the open and closed state of KCa3.1. (Left) Representation of the S5-P-helix-S6 region viewed as a profile illustrating the predicted orientation of Cys276 (yellow) and the L281W mutation (red) in the closed state using the KcsA structure. (Inset) Structure of PCMBS adapted from the crystal structure of PCMBS in complex with the Charcot-Leyden crystal protein (Ackerman et al., 2002). PCMBS is 6.5 Å in length and 9.0 Å in length when the thiol group is included. The color red represents oxygen molecules, yellow (sulfur), cyan (carbon), and white (mercury). (Right) Representation of the S5-P-helix-S6 region viewed as a profile illustrating the predicted orientation of Cys276 (yellow) and the L281W mutation (red) in the open state based upon the structure of rKv1.2. Sequence alignments used for homology modeling can be found in Fig. 5 C. (Inset) Representation of S5 and S6 viewed from the intercellular aspect of the pore to illustrate that Leu281 (L281W) is oriented toward S5. Cys276 and L281W from the adjacent subunit are the only residues illustrated to compare the predicted orientation in the closed and open state. The S5 and P-helix are colored green and the S6 helix is colored blue. All residues are illustrated in VDW format. The C-terminal portion of the S5 helix was removed to prevent obscuring the view of L281W.

