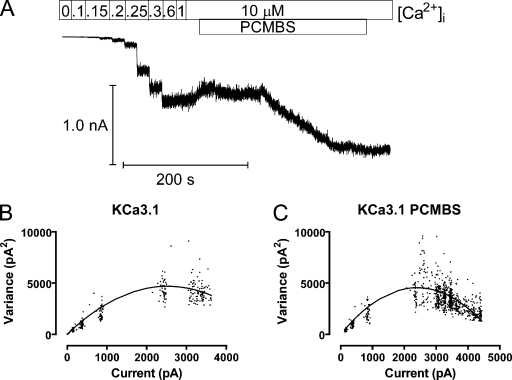
Figure 2.
PCMBS increases steady-state Po(max). Variance analysis of KCa3.1 channel current was used to estimate Po(max), N, and i in the absence and presence of PCMBS. (A) Representative Ca2+ concentration response experiment recorded from inside-out macropatches expressing KCa3.1 channels. Patches were initially excised in 10 µM Ca2+i, followed by a series of Ca2+i concentrations (0, 0.1, 0.15, 0.2, 0.25, 0.3, 0.6, 1.0, and 10 µM) applied for 10-s intervals using a fast solution exchanger. After establishing steady-state current in 10 µM Ca2+i, PCMBS (500 µM) was added to the bath solution until reaching a second, steady-state, current level. (B) Variance analysis to determine Po(max), N, and i in the absence of PCMBS. Plot of variance (σ2), which was calculated from the portion of the record excluding the time when PCMBS was added, against mean current 〈I〉 as fit with Eq. 1 (solid line), and Po(max) was calculated using Eq. 2: Po(max) = 0.61, n = 1,071, and i = 3.5 pA. (C) Variance analysis to determine Po(max), N, and i in the presence of PCMBS. Plot of σ2, which was calculated from the entire record against 〈I〉 was fit with Eq. 1 (solid line), and Po(max) was calculated using Eq. 2: Po(max) = 0.91, n = 1,078, and i = 3.4 pA.

