Figure 3.
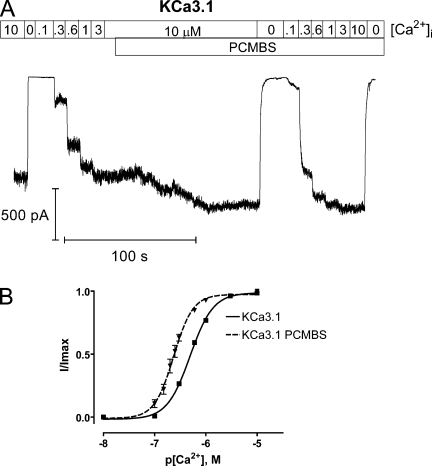
PCMBS shifts apparent Ca2+ affinity. Complete Ca2+ concentration response experiments were performed to estimate EC50 and the Hill coefficient (h) in the absence and presence of PCMBS. (A) Representative macroscopic current record from an inside-out patch–expressing KCa3.1 channels. The patch was excised in 10 µM Ca2+i followed by a series of Ca2+i concentrations beginning with 0, 0.1, 0.3, 0.6, 1.0, 3.0, and 10 µM Ca2+i , all applied in 10-s intervals using a rapid solution exchanger. After the current reached a steady-state level, PCMBS (500 µM) was added, and a second Ca2+i concentration response experiment was performed using the above Ca2+i concentrations in the presence of PCMBS. (B) Plot of normalized 〈I〉 current against the corresponding Ca2+i for KCa3.1 (■) and KCa3.1+PCMBS (▾) fit with a variation of the Hill equation (see Materials and methods). This analysis gave estimates for KCa3.1 (solid line, n = 57), EC50 = 508 ± 13 nM and h = 2.0 ± 0.2, and KCa3.1+PCMBS (dashed line, n = 6), EC50 = 235 ± 17 nM and h = 2.5 ± 0.2. All experiments were done in pairs, but an alternate set of Ca2+i concentrations (0.1, 0.15, 0.2, 0.25, 0.3, 0.6, 1.0, and 10 µM) were used when estimating EC50 and h for KCa3.1+PCMBS. Error bars represent SEM. The error bars for KCa3.1 are smaller than the symbols (■).

