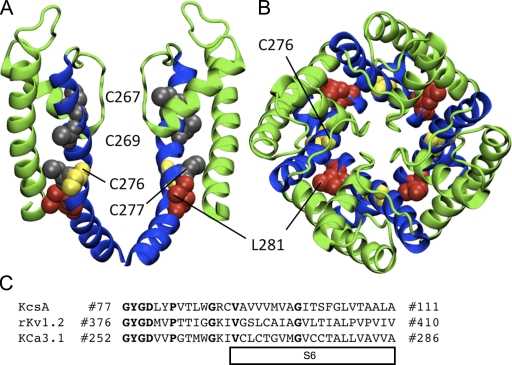
Figure 5.
Homology model of the pore region for the open state of KCa3.1 using the rKv1.2 structure. (A) Representation of the S5-P-helix-S6 region viewed as a profile illustrating the predicted orientation of Cys267, Cys269, Cys277 (all in gray), Cys276 (yellow), and Leu281 (red). Only two of the four subunits are shown for clarity. (B) Representation of the S5-P-helix-S6 region from the extracellular entrance showing the predicted nonluminal orientation of Cys276 (yellow) and Leu281 (red). The S5 and P-helix are colored green and the S6 helix is colored blue. All residues are illustrated in VDW format. (C) Sequence alignment used for the homology model of KCa3.1 in the open state (rKv1.2) and the closed state (KcsA model illustrated in Fig. 15). Bold font represents homologous amino acids used as a guide to align sequences.

