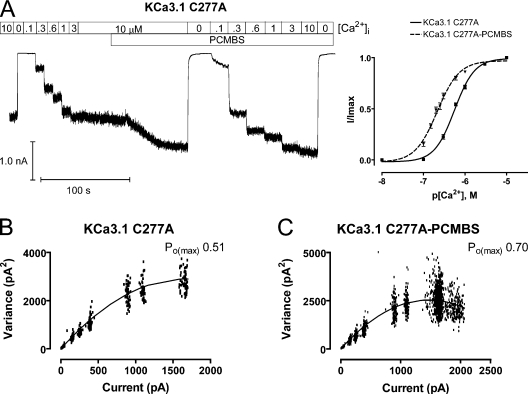
Figure 6.
PCMBS increases channel activation for KCa3.1 C277A. Ca2+ concentration response experiments and variance analysis were undertaken to determine whether PCMBS increases C277A channel activation in the same manner observed for the WT channel. (A, left) Representative macroscopic current record from an inside-out patch expressing KCa3.1 C277A channels. All experiments were performed using the Ca2+ concentraiton response protocol described in Fig. 3. (A, right) Plot of normalized 〈I〉 current against the corresponding [Ca2+]i for KCa3.1 C277A (■) and KCa3.1 C277A+PCMBS (▾). All analysis was performed according to the protocol described in Fig. 3 to give averages: KCa3.1 C277A (solid line, n = 15), EC50 = 566 ± 24 nM and h = 1.9 ± 0.1, and KCa3.1 C277A+PCMBS (dashed line, n = 7), EC50 = 220 ± 14 nM and h = 1.7 ± 0.2. Error bars represent SEM. (B) Variance analysis as described in Fig. 2 to determine Po(max), N, and i in the absence of PCMBS: Po(max) = 0.51, n = 954, and i = 3.5 pA. (C) Variance analysis as described in Fig. 2 to determine Po(max), N, and i in the presence of PCMBS Po(max) = 0.70, n = 849, and i = 3.5 pA. Analysis of multiple patches (n = 6) indicates that PCMBS increases Po(max) from 0.55 ± 0.02 to 0.84 ± 0.03 without increasing N or i (3.8 ± 0.1 pA versus 3.9 ± 0.1 in PCMBS).

