Figure 3.
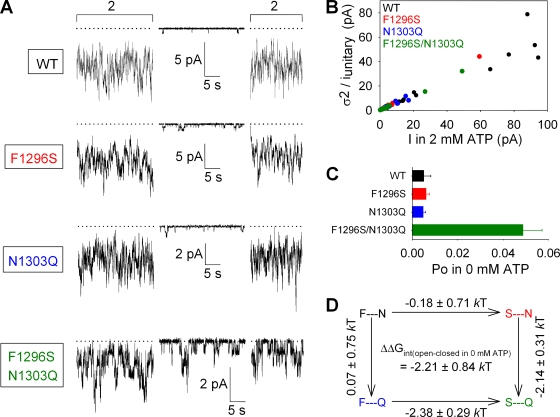
A stabilizing interaction between sites 1 and 2 facilitates channel opening in the absence of ATP. (A) Representative traces of WT, F1296S, N1303Q, and F1296S/N1303Q currents illustrating segments in 0 mM ATP and bracketing segments in 2 mM ATP. Dotted lines show zero current level. (B) Estimation of Po;max for WT (black), F1296S (red), N1303Q (blue), and F1296S/N1303Q (green) by stationary noise analysis. Each symbol plots the variance of macroscopic current fluctuations divided by the unitary current amplitude for a steady segment of recording in 2 mM ATP, as a function of the mean current. Open probabilities calculated for each individual segment were averaged to obtain final Po;max estimates (refer to Materials and methods) for each construct. (C) Po values in 0 mM ATP (Po;bas), computed as the product of Po;bas/Po;max ratios (refer to Materials and methods) and Po;max values (from B). (D) Thermodynamic mutant cycle built on Po;bas/(1−Po;bas) values; each corner is represented by the side chains at sites 1 and 2, respectively. ΔΔG0 values (mean ± SEM) on arrows show mutation-induced changes in the stability of the open state with respect to the closed state in the absence of ATP, and were used to calculate (refer to Materials and methods) the coupling energy for the site-1–site-2 interaction (ΔΔGint(open–closed in 0 mM ATP)).

