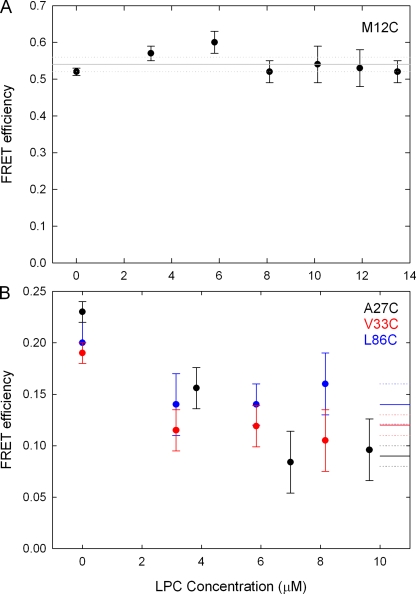
Figure 4.
FRET efficiency versus LPC concentration. (A) For mutant M12C, the measured FRET efficiency shows no change upon the addition of LPC. (B) For mutants A27C, V33C, and L86C, the FRET efficiency decreases upon the addition of LPC, but it does not decrease further when LPC concentration is >6 µM. The average post-LPC FRET values and associated uncertainties (as reported in Table II) are represented by the solid and dashed lines on the right-hand side of the figure.

