Figure 4.
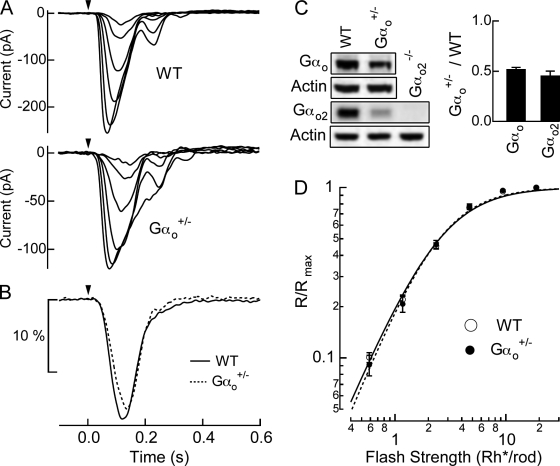
Reduced Gαo expression in Gαo+/− mice does not alter rod bipolar responses (A) Responses to a family of flashes producing 0.59, 1.2, 2.4, 4.7, 9.4, and 19 Rh*/rod were recorded in a WT (Gαo+/+ littermate), and a Gαo+/− rod bipolar cell. (B) Normalized rod bipolar response to dim flashes producing 1 Rh*/rod was estimated by averaging normalized responses to dim flashes casing 5–25% of maximal responses and dividing it by the average dim flash strength, which was 0.73 Rh*/rod for WT and 0.79 Rh*/rod for Gαo+/−. The WT response is the average of 437 dim flash responses across 14 cells from 3 mice, and the Gαo+/− response is the average of 271 dim flash responses across 15 cells from 3 mice. (C) The total amount of Gαo and Gαo2 proteins in WT and Gαo+/− retinas were compared using Western blot analysis. The amount of Gαo2 proteins in Gαo2−/− retinas was also examined to check the specificity of the antibody. The protein level of Gαo+/− retina was normalized to that of WT retina for a pair of WT and Gαo+/− mice used in one experiment, and the collected results are shown in the bar graph. The error bars are the SEM. The Gαo protein levels were 1 vs. 0.52 ± 0.02 (n = 4) and the Gαo2 protein levels were 1 vs. 0.46 ± 0.04 (n = 3) (mean ± SEM, WT vs. Gαo+/−). (D) Normalized response amplitudes from individual families were averaged across cells for WT rod bipolar cells (n = 14) and Gαo+/− rod bipolar cells (n = 15) and plotted as a function of flash strength. Half-maximal flash strengths estimated from the Hill curve fits were 2.5 ± 0.13 vs. 2.5 ± 0.17 Rh*/rod, and the Hill exponents were 1.54 ± 0.04 vs. 1.62 ± 0.06 (mean ± SEM, WT vs. Gαo+/−).

