Figure 3.
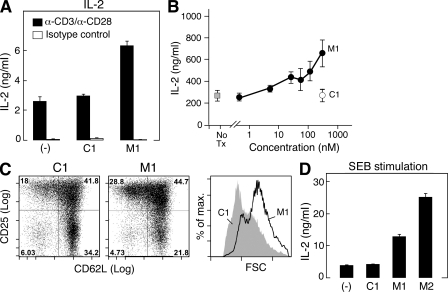
Human T cells respond to IAP antagonists. (A–C) 105 human CD4+ T cells were isolated from the peripheral blood by positive selection using magnetic beads and stimulated with agonistic antibodies to 10 µg/ml anti-CD3 and 2 µg/ml anti-CD28 in the presence of M1 or a control compound at 500 nM (A and C) or as indicated (B). (A and B) IL-2 was measured after 48 h in the culture supernatant by ELISA. (C) Cells were stimulated for 72 h, and CD25, CD62L, and forward scatter (FSC) were measured by flow cytometry. (D) 2 × 10⁵ human PBMCs were incubated with SEB for 96 h in the presence of 500 nM M1 or control compound. (A–D) Error bars represent SEM. Results are representative of at least three independent experiments.

