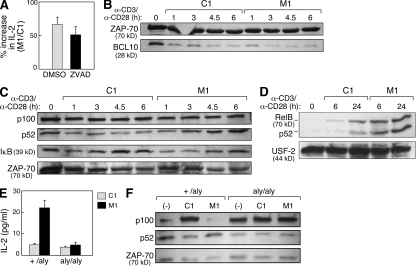
Figure 4.
IAP antagonists enhance T cell activation through the induction of alternative NF-κB signaling. (A–F) Mouse CD4+ T cells were isolated as in Fig. 1 or as indicated and stimulated with 10 µg/ml anti-CD3 and 2 µg/ml anti-CD28 in the presence of M1 or control compound at 500 nM. (A) CD4+ T cells were isolated and stimulated in the presence of the caspase inhibitor ZVAD-fmk or vehicle (DMSO). Data are presented as the ratio of IL-2 production measured in culture supernatants from M1-treated cells compared with control treatment. (B) Immunoblot for BCL10 in total cell lysates from stimulated CD4+ T cells. Lysates are identical to those depicted in Fig. 1 B. (C and D) Immunoblots using the indicated antibodies on total cell lysates (C) or purified nuclear lysates (D) from stimulated CD4+ T cells. (E) 105 naive T cells isolated from +/aly or aly/aly mouse spleens as depicted in Fig. S6 and stimulated in the presence of M1 or control compound. IL-2 was measured by ELISA. (A and E) Error bars represent SEM. (F) Immunoblots using the indicated antibodies on cell lysates from total +/aly or aly/aly CD4+ T cells isolated using magnetic beads and immediately lysed (−) or lysed after 24 h of stimulation (C1 and M1). (A–F) Results represent at least two independent experiments.

