Figure 6.
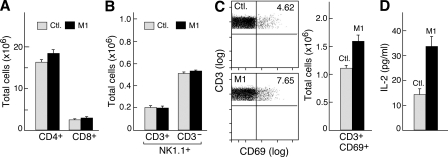
Systemic delivery of IAP antagonists is well tolerated and leads to T cell hyperresponsiveness. (A–D) Mice were administered 750 µg M1 daily for 1 wk by gastric lavage. Spleen cells were harvested and analyzed by flow cytometry using the indicated markers. Six animals were used per group. (A) Comparison of total CD4+ and CD8+ T cells in mice treated with M1 or control (Ctl.) compound. (B) Quantification of NK1.1/CD3 staining on spleen cells from M1-treated mice. (C, left) Flow cytometry plots showing CD69+CD3+ T cells in M1-treated and control animals. (right) Quantification of CD69/CD3 staining from the left panel. (D) 105 CD4+ T cells were isolated from mice treated with M1 and stimulated with anti-CD3/CD28 for 48 h. Labels refer to the treatment conditions of the mouse from which T cells were isolated for analysis; IL-2 was measured by ELISA. (A–D) Error bars represent SEM. Results are representative of two independent experiments.

