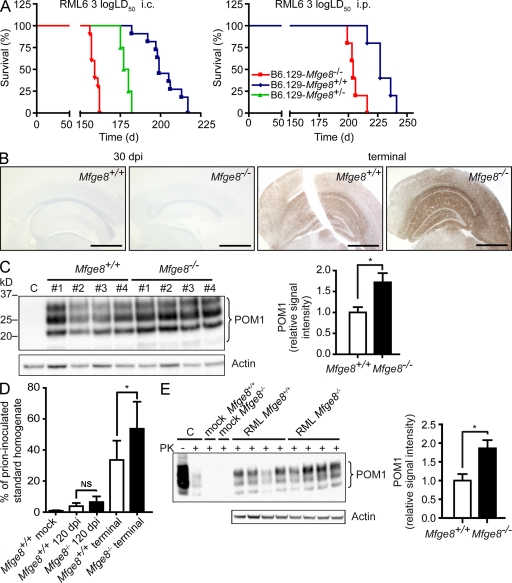
Figure 1.
Mfge8−/− mice show accelerated disease progression. (A) B6.129-Mfge8−/−, B6.129-Mfge8−/+, and B6.129-Mfge8+/+ were inoculated i.c. with 3 log LD50 (n = 10 for Mfge8−/−, n = 4 for Mfge8+/−, and n = 11 for Mfge8+/+) and i.p. with 3 log LD50 per group of RML6 prions. The mean incubation time after i.c. inoculation was significantly accelerated in Mfge8−/− mice (159 ± 2 d in Mfge8−/−, 179 ± 3 d in Mfge8+/−, and 202 ± 3.9 d in Mfge8+/+ mice; P < 0.0001, logrank). Differences in incubation time after i.p. inoculation were less pronounced (206 ± 6 d in Mfge8−/− and 229 ± 10 d in Mfge8+/+ mice) but still significant (P = 0.004, logrank test). (B) Stainings of brain sections after 30 dpi (left) or at terminal stage (right) using anti-PrP antibody SAF84. Bars, 1 mm. (C) Western blot of PK-digested brain homogenates from i.c. inoculated Mfge8+/+ and Mfge8−/− mice using anti-PrP antibody POM1 (C, uninoculated brain homogenate). Western blot for actin on non-PK–digested sample is shown below. Densitometric quantitation of POM1 signal normalized over actin expression. Bar graph shows mean relative signal intensity (n = 4; *, P = 0.03; Student’s t test). (D) MPA of brain homogenates from Mfge8+/+ and Mfge8−/− mice at 120 dpi or at terminal disease (n = 6–7 mice per group; *, P = 0.034; Student’s t test) indicated in percentages of RML6 prion–inoculated brain homogenate. Mfge8−/− mice sacrificed at 120 dpi showed a slight increase over Mfge8+/+ mice. (E) Mfge8+/+ and Mfge8−/− cerebellar slices were inoculated with 3 × 3 log LD50 RML6 prions or with noninfectious brain homogenate (mock), harvested after 5 wk, homogenized, and PK digested (C, brain homogenate from a terminal RML inoculated mouse used as positive control). PrPSc levels were analyzed by Western blotting using POM1 and normalized against actin (without PK digestion) by densitometry (bar graph; n = 4; *, P = 0.024; Student’s t test). Error bars represent SD. Histology, Western blot, and MPA results represent at least four independent experiments.

