Figure 2.
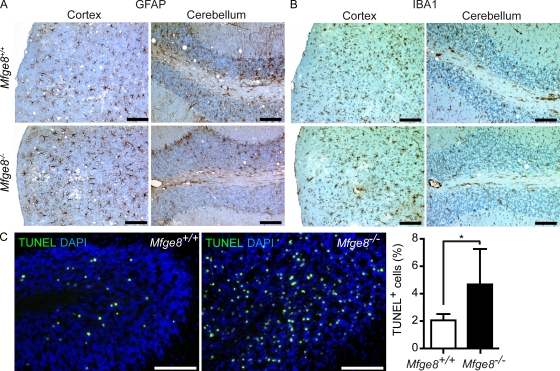
Histopathological analysis of terminal Mfge8−/− brains. (A) Astroglia proliferation was analyzed by GFAP staining. (B) Microglial activation was visualized by IBA1 staining. (C) TUNEL staining on cerebellar cryosection of i.c. inoculated B6.129-Mfge8−/− (n = 5) and B6.129-Mfge8+/+ mice (n = 7). Sections were counterstained with DAPI. Bar graph shows quantitation of TUNEL+ cells from at least three cerebellar areas per mouse. Number of TUNEL+ cells was normalized against the number of DAPI+ nuclei. Graph shows percentage of TUNEL+ cells per area ± SD (*, P = 0.023; Student’s t test). Results summarize at least five independent experiments. Bars: (A and C) 100 µm; (B) 200 µm.

