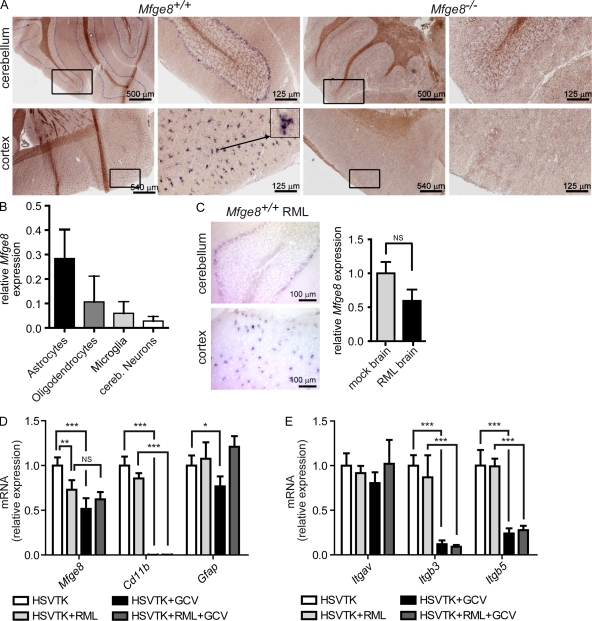
Figure 3.
Analysis of the cellular source of Mfge8. (A) ISH for Mfge8 on brain cryosections. Mfge8+ cells (dark purple) were found in cerebellar (top) and cortical areas (bottom). Low and high magnification photographs of the same cerebellar (top) and cortical (bottom) areas are shown. Boxes indicate areas shown in higher magnifications. The arrow indicates the cell shown in high magnification. (B) Expression of Mfge8 in cultured astrocytes, microglia, oligodendrocytes, and neurons was quantified by quantitative RT-PCR. Mfge8 expression in each subset relative to total brain is shown (n = 3). (C) ISH for Mfge8 in prion-inoculated Mfge8+/+ mice at terminal stage (left). Right panel shows relative Mfge8 mRNA expression in mock- and RML-inoculated brains as assessed by quantitative RT-PCR (n = 3). (D) Quantitative RT-PCR quantitation of Mfge8, Cd11b, and Gfap expression in cerebellar slice cultures from untreated CD11b-HSVTK mice (HSVTK), prion-inoculated untreated CD11b-HSVTK mice (HSVTK + RML), GCV-treated CD11b-HSVTK mice (HSVTK + GCV), and prion-inoculated GCV-treated CD11b-HSVTK mice (HSVTK + RML + GCV; Student’s t test; n = 4). Uninfected HSVTK + GCV slices compared with HSVTK slices have a slight but significant reduction of Mfge8 (***, P = 0.0007). No difference in expression in HSVTK + RML + GCV slices compared with HSVTK + RML slices (NS, P = 0.1566). HSVTK + RML slices compared with HSVTK show significant down-regulation (**, P = 0.0082). CD11b expression is down-regulated by almost 3 logs in GCV -treated slices, confirming efficient depletion of microglia (HSVTK + GCV: ***, P < 0.0001; HSVTK + RML + GCV: ***, P < 0.0001). Gfap expression is slightly reduced after GC treatment (HSVTK + GCV: *, P = 0.0255). (E) Analysis of integrin αv (Itgav), β3 (Itgb3), and β5 (Itgb5) expression by quantitative RT-PCR (Student’s t test; n = 4). No significant changes in Itgav expression were found. Itgb3 and Itgb5 were down-regulated in GCV-treated compared with nontreated slices (Itgb3 HSVTK + GCV: ***, P < 0.0001; Itgb3 HSVTK + RML + GCV: ***, P = 0.0007; Itgb5 HSVTK + GCV: ***, P = 0.0002; Itgb5 HSVTK + RML + GCV: ***, P < 0.0001). Error bars represent SD. ISH and quantitative RT-PCR results are shown representative of 3 and 12 independent experiments, respectively.

