Figure 9.
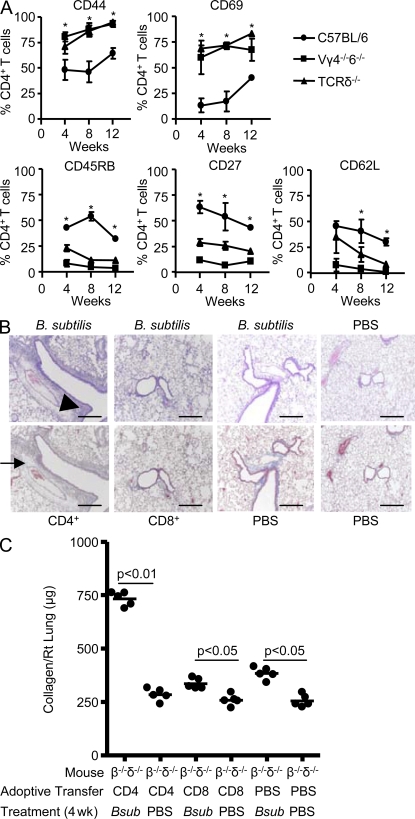
CD4+ T cells represent the pathogenic T cell subset and induce lung fibrosis. (A) Expression of CD44, CD69, CD45RB, CD27, and CD62L on CD4+ T cells isolated from the lungs of WT C57BL/6, TCR-δ−/−, and Vγ4−/−6−/− mice treated with B. subtilis for 4, 8, and 12 consecutive weeks is shown. Data represent the mean ± SD of at least five mice at each time point treated with B. subtilis from at least two separate experiments. The asterisks denote a statistically significant (P < 0.05) difference in the percentage of CD4+ T cells that express each surface marker from the lung of WT C57BL/6 compared with TCR-δ−/− mice treated with B. subtilis at each time point. (B) Representative H&E (top) and Masson trichrome (bottom) staining of lungs from TCR-β−/−δ−/− mice reconstituted with either CD4+ or CD8+ T cells or sterile PBS followed by intranasal treatment with either B. subtilis or sterile PBS for four consecutive weeks is shown. Arrowhead denotes mononuclear infiltrates in the peribronchovascular space. Arrow denotes collagen deposition in a peribronchovascular distribution. Data represent at least four individual mice from at least two separate experiments for H&E and Masson Trichrome staining (40×). Bars, 100 µm. (C) Quantification of collagen content using Sirius Red by colorimetric assay in the lungs of individual TCR-β−/−δ−/− (β−/−δ−/−) mice reconstituted with CD4+, CD8+, or sterile PBS by tail vein injection followed by repeated intranasal treatment with B. subtilis (Bsub) or sterile PBS for four consecutive weeks. The mean is shown as a solid line. Data were compiled from five individual mice from at least two separate experiments.

