Figure 1.
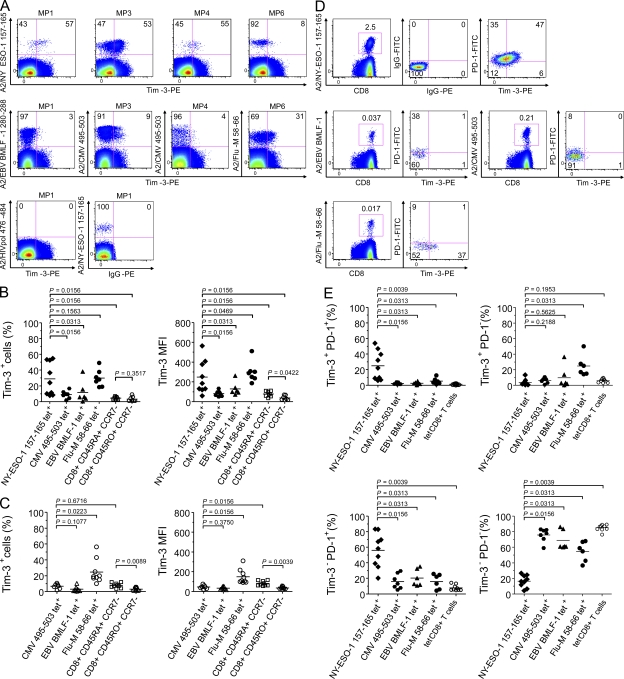
Tim-3 is up-regulated and coexpressed with PD-1 on NY-ESO-1–specific CD8+ T cells. (A) Representative dot plots from melanoma patients (MP) showing ex vivo Tim-3 expression on A2/NY-ESO-1 157–165, A2/EBV BMLF-1 280–288, A2/CMV 495–503, and A2/Flu-M 58–66 tet+ CD8+ T cells. As shown for one melanoma patient (MP1), CD8+ T cells stained with A2/HIVpol 476–484 tetramers or PE-labeled IgG control Ab were used to establish the threshold for identifying tet+ cells and Tim-3+ cells, respectively. (B and C) Pooled data showing the percentage (%) and MFI of Tim-3 expression on NY-ESO-1–, CMV-, EBV-, and Flu-specific CD8+ T cells, as well as total effector (CD45RA+ CCR7−) and effector/memory (CD45RO+ CCR7−) CD8+ T cells from nine melanoma patients (B) and nine healthy donors (C). (D) Dot plots from one representative melanoma patient showing ex vivo Tim-3 and PD-1 expression on A2/NY-ESO-1 157–165, A2/EBV BMLF-1 280–288, A2/CMV 495–503 and A2/Flu-M 58–66 tet+ CD8+ T cells. As control, A2/NY-ESO-1 157–165 tet+ CD8+ T cells stained with PE-labeled and FITC-labeled IgG control antibodies are shown. (E) Pooled data showing the distribution of NY-ESO-1–, CMV-, EBV-, and Flu-specific CD8+ T cells, as well as total tet− CD8+ T cells according to Tim-3 and PD-1 expression. Horizontal bars depict the mean percentage or MFI of Tim-3 and/or PD-1 expression on tet+ CD8+ T cells. The p- values were calculated using the Wilcoxon signed rank test. Data shown are representative of at least three independent experiments.

