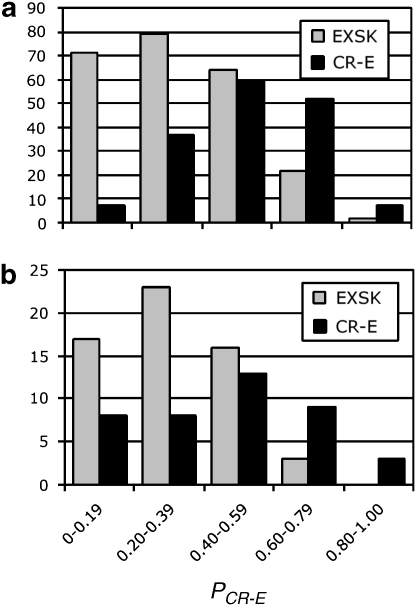
Figure 1.
PCR-E distribution of exonic sequences that underwent cryptic splice-site activation or exon skipping. (a) Training set; (b) independent set. All exonic sequences, the intrinsic strength of their authentic and cryptic splice sites, underlying mutations and their phenotypic consequences are described in the online Database of Aberrant Splice Sites. Their PCR-E values were determined as in Equation (1). Each column shows the number of EXSK (gray) or CR-E (black) events that had the PCR-E value in the interval shown on the x-axis.

