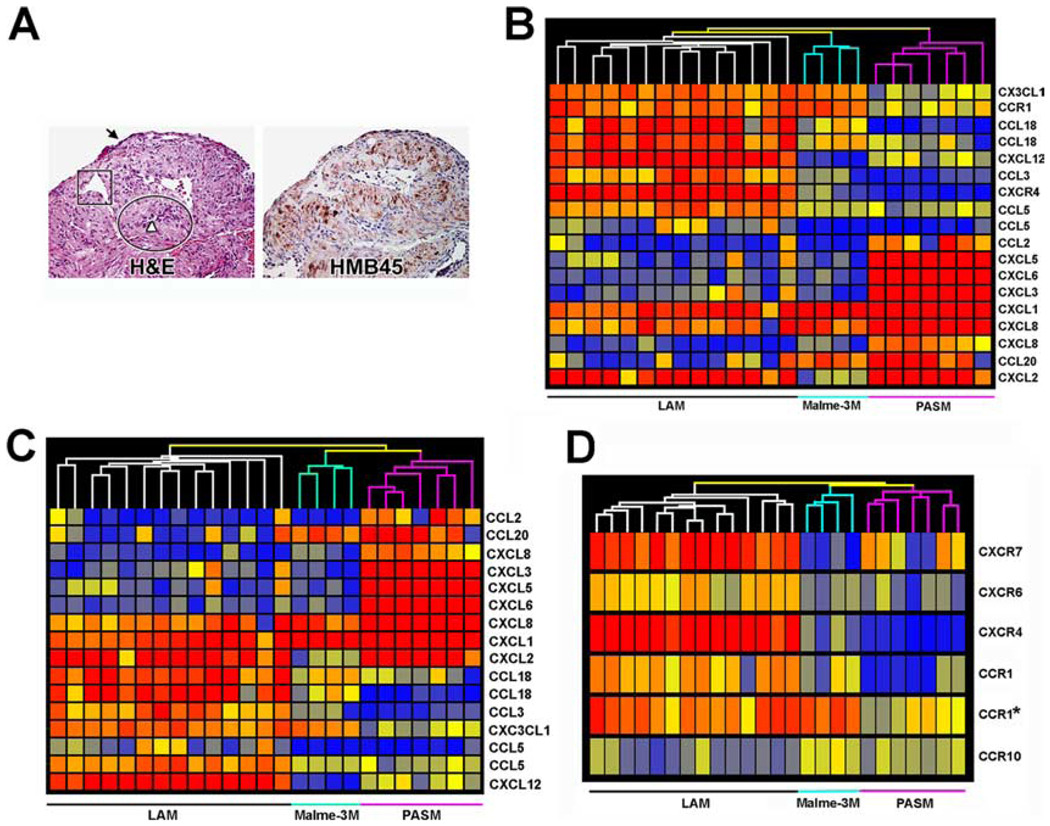
FIGURE 1.
Gene expression profile of microdissected LAM cells. A, Serial sections (magnification, ×200) of lung from one LAM patient, representative of samples from 30 patients. Left, Stained with H&E. Arrow indicates type II pneumocytes; a proliferative area of LAM cells is shown in the oval; square outlines vascular structure in close proximity to the proliferating LAM cells; arrowhead indicates lymphatic-like structures. Right, Reactivity of LAM cells with mAb HMB-45. B, Hierarchical cluster diagram of 18 probe sets differentially expressed among the 79 probe sets that represent chemokines and chemokine receptors. C, Among the 18 probe sets, 13 chemokines clustered LAM cells from PASM and Malme-3M. D, Five chemokine receptors, that is, CXCR7 (212977_at), CXCR6 (206974_at), CXCR4 (217028_at), CCR1 (205098_at and 205099_s_at), and CCR10 (220565_at), differentiate gene expression in LAM cells from PASM and Malme-3M cells. The probes used for clustering are indicated in Table II.

