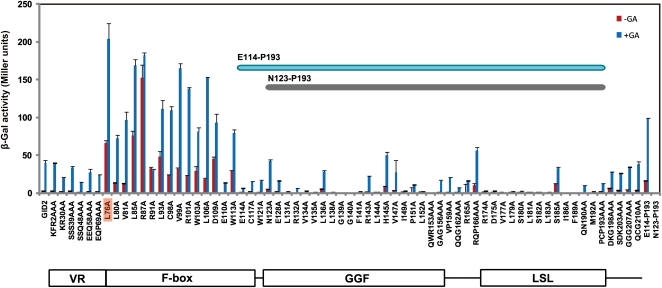
Figure 5.
Ala Scanning Analysis of GID2 for SLR1-Interacting Activities.
SLR1-interacting activity of 68 mutated GID2s and the wild-type GID2 was assessed using a Y3H assay with GID2s as baits, the full-length SLR1 as prey, and GID1 expressed as a third clone (means ± sd; n = 3). Interactions were analyzed in the absence (red bars) or presence (blue bars) of 10−4 M GA4. Activity of wild-type GID2 is shown at the far left of the graph. The minimum region necessary for SLR1 interaction (E114-P193) is indicated within the graph. Activities of regions E114-P193 and N123-P193 are shown at the far right side of the graph. A schematic structure of GID2 is shown at the bottom.

