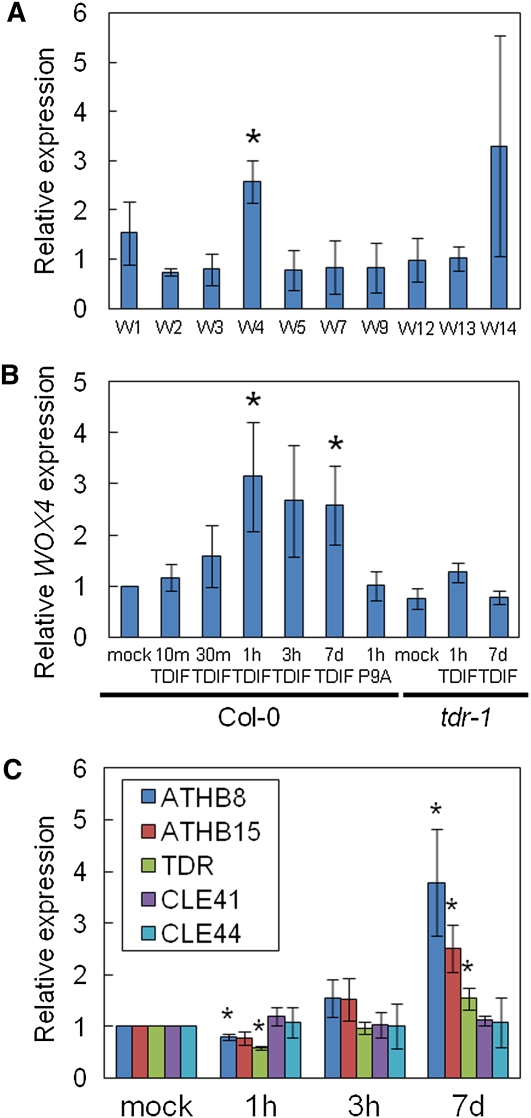
Figure 1.
Identification and Expression Analyses of TDIF Signaling Target Genes.
(A) Effects of TDIF treatment on relative expression levels of WOX genes in the top part of 7-d-old seedlings. For each WOX gene, the rate of expression level of TDIF treatment per P9A treatment as measured by qRT-PCR is shown. The asterisk indicates significant difference between TDIF and P9A treatment. Peptides were treated for 7 d.
(B) Relative WOX4 expression level measured by qRT-PCR in Col-0 and tdr-1 plants that were either mock treated or treated with TDIF or P9A for the indicated amounts of time. Enhancement of WOX4 expression compared with mock treatment was observed only in the samples treated with TDIF for 1 h or more. The values of expression level are normalized by both the mock treatment in Col-0 and TUA4.
(C) Relative expression levels of procambium marker genes (ATHB8, ATHB15, and TDR) and the TDIF genes (CLE41 and CLE44). Expression levels of the procambium marker genes but not the TDIF genes were significantly upregulated compared with mock treatment only when plants were treated with TDIF for 7 d. The values of expression level are normalized by both the mock treatment and TUA4.
Error bars indicate sd, n = 3; *Student’s t test significance at P < 0.05 for different means.

