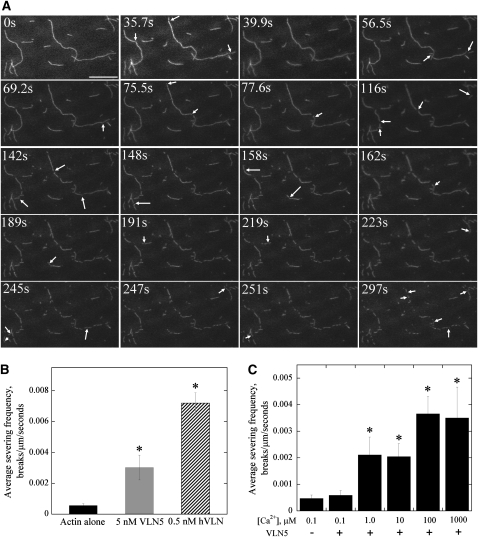
Figure 11.
Direct Visualization of VLN5 Severing Activity by Time-Lapse TIRFM.
(A) Prepolymerized, 25 nM rhodamine-labeled actin filaments were introduced into a perfusion chamber, where they were attached to the coverglass by NEM-myosin. Five nanomolar VLN5 was injected into the perfusion chamber in the presence of 1 μM free Ca2+. Individual actin filaments showed an increasing number of breaks (arrows) as time elapsed. Bar = 20 μm. See Supplemental Movie 1 online for the entire series.
(B) The severing activity of VLN5 is less potent than that of human villin (hVLN). Either 5 nM VLN5 or 0.5 nM hVLN was perfused into a chamber containing 25 nM actin filaments in the presence of 1 μM free Ca2+. The average severing frequency was plotted in the presence or absence of villins. Error bars represent ± se (n = 15). Asterisks represent values that were significantly different from that of the no villin control (*P < 0.05 by a Student’s t test).
(C) The severing activity of VLN5 is Ca2+ dependent. Five nanomolar VLN5 in the presence of various concentrations of Ca2+ was perfused into the perfusion chamber and time-lapse images were collected. At least 15 filaments for each experimental treatment were selected to calculate the average severing frequency, and the average severing frequency was plotted against [Ca2+]. Error bars represent ± se; n = 3 for each data set. Asterisks represent values that were significantly different from that of the no villin control (*P < 0.05 by a Student’s t test).

