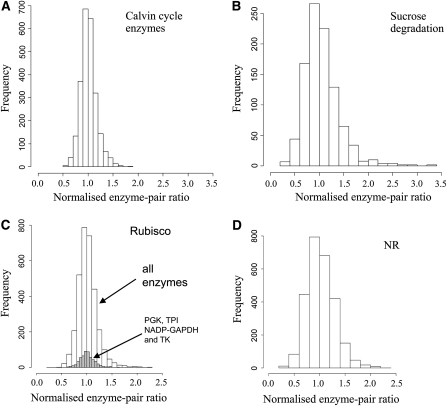
Figure 4.
Frequency Histogram of the Enzyme-Enzyme Ratios for Enzymes from Different Pathways across the Entire Set of Accessions.
The enzymes were assigned to five subsets: Calvin-Benson cycle enzymes, sucrose synthesis, nitrogen metabolism, enzymes of sucrose degradation, and respiration. For each enzyme, the activity in a given accession was normalized to the mean activity of that enzyme in all of the accessions. This allowed activity ratios in the same range to be obtained for each enzyme pair; a value of 1 thus represents the average value across all the accessions. The activity ratio was then calculated for each enzyme-enzyme pair from each set in each accession. The values were then summed and depicted as a frequency plot. Significance of the plots obtained was addressed by shuffling 1000 times the normalized activities and comparing the frequency distribution of the standard deviations of the ratios against the standard deviation of the ratios obtained with the real data (see Supplemental Figure 3 online).
(A) Calvin-Benson cycle (Rubisco, PGK, NADP-GAPDH, TPI, and TK).
(B) Sucrose degradation (INV, SuSy, GK, and FK).
(C) Rubisco compared with all other enzymes (white bars) and selected Calvin-Benson cycle enzymes (gray bars, PGK, NADP-GAPDH, TPI, and TK).
(D) NR activity compared with the activity of all other enzymes.

