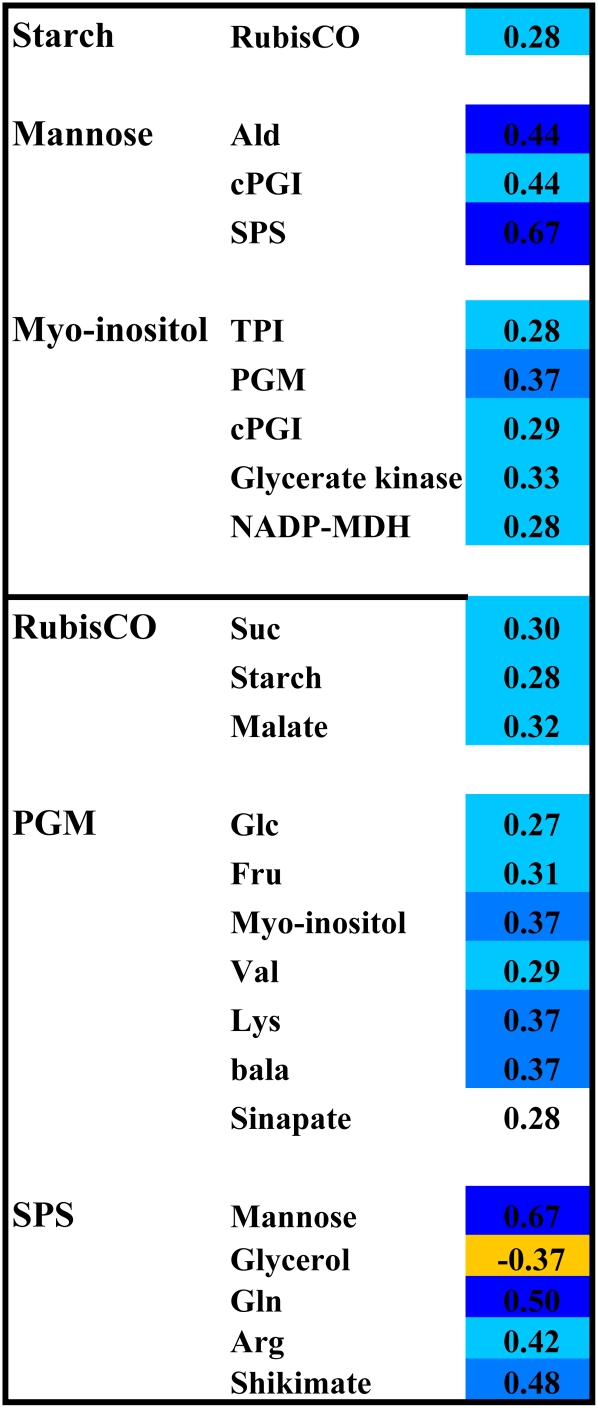
Figure 5.
Correlation between Enzyme Activities and Metabolites.
The display shows selected examples of significant Spearman correlation coefficients between enzyme activities and metabolites. The number indicates the R value and the color shading the P value (light, medium, and dark shading represent pBH <0.05, <0.01, and <0.001, respectively). A full list of all correlation coefficients is provided in Supplemental Data Set 2A online. Blue colors are for positive correlations. The yellow shading is used for a negative correlation with pBH < 0.01.

