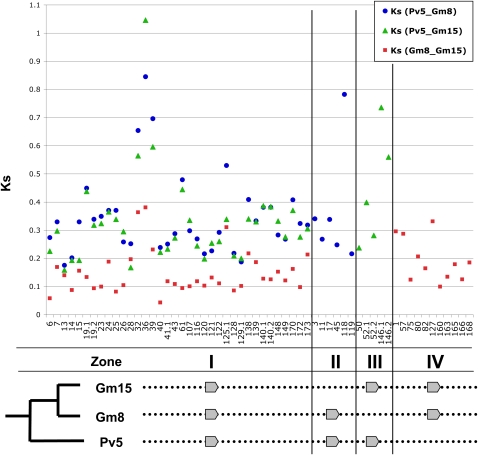
Figure 2.
Distribution of Ks Values of Genes in Both Soybean Homoeologs and Phaseolus.
Blue circles are Ks values from Pv5-Gm8; green triangles are Ks values from Pv5-Gm15; red boxes are Ks values from Gm8-Gm15. Different zones show the Ks from different homoeologous and orthologous counterparts. Zone I shows the Ks from the pairwise comparison of the two soybean homoeologs and one Phaseolus ortholog. Zone II shows the Ks from the sequence comparisons of Pv5 orthologs and Gm8 homoeologs. Zone III shows the Ks from Pv5 orthologs and Gm15 homoeolog comparisons. Zone IV shows the Ks from homoeologs between Gm8 and Gm15. Numbers below the plot are the annotated gene numbers. Ks value of gene114 (Pv5-Gm15) is ~2.8 due to extensive variation outside the conserved protein domain, and it is not shown here.

