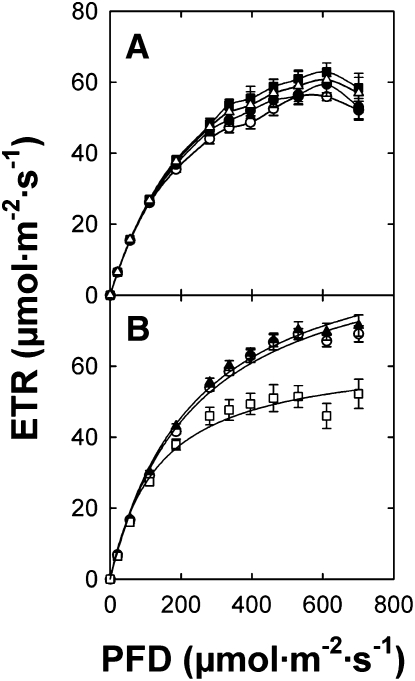
Figure 9.
Light Saturation Curves of Photosynthetic ETRs Determined by Imaging Pulse Amplitude Modulation Fluorometry.
(A) Comparison of light saturation curves between Col-0 (open circles), eno1-2 (triangles), Col-0 ENO1 (A) (closed circles), and Col-0 ENO1 (C) (squares).
(B) Comparison of light saturation curves between Col-0 (cirlces), cue1-6 (squares), and cue1-6 ENO1 (4) (triangles).
The data represent the mean ± se of n = 9 measurements on individual plants per line.

