Figure 1.
Structure and Expression of Nt GTBPs.
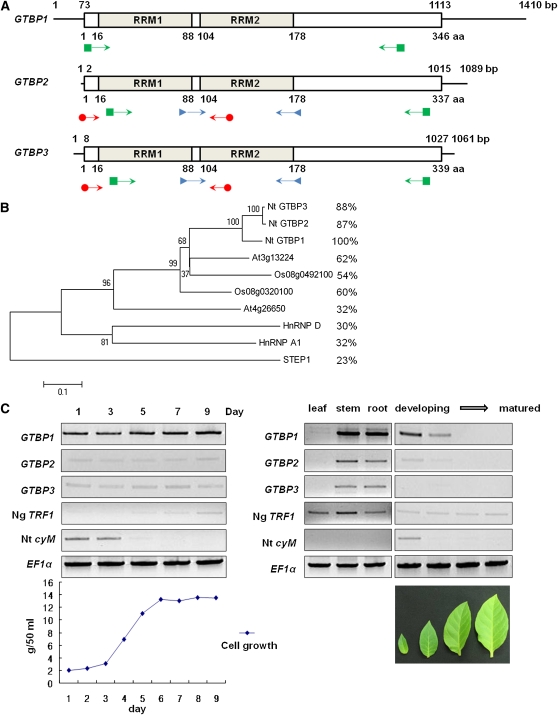
(A) Schematic representation of three tobacco GTBP cDNAs and their predicted proteins. The solid lines show 5′- and 3′-untranslated regions. The bars depict coding regions. The RRMs (RRM1 and RRM2) are indicated. PCR primers for partial cDNA cloning, 5′- and 3′-RACE, and RT-PCR are indicated by arrows with triangles, circles, and squares, respectively.
(B) Phylogenetic relationship of 10 GTBP homologs from tobacco, Arabidopsis, rice, and human. The tree was constructed using MEGA4 software with the neighbor-joining method and the summed branch length of the tree is 3.21911554. Amino acid identities of these proteins to GTBP1 are shown in right side. A text file of the alignment used to generate this tree is available as Supplemental Data Set 1 online.
(C) Expression profiles of three GTBP paralogs. Total RNA was isolated from BY-2 cells over the course of 9 d (left gel) and from leaves, stems, and roots of 1-month-old tobacco plants (right gel) and analyzed by RT-PCR using gene-specific primers. Growth curve of BY-2 cells is shown in the bottom of left panel. Tobacco leaves that are in four different developmental stages are shown in the bottom of the right panel. Ng TRF1 and Nt cyM were used as G-phase and M-phase markers, respectively. The level of elongation factor 1α (EF1α) transcript is shown as a loading control.
[See online article for color version of this figure.]

