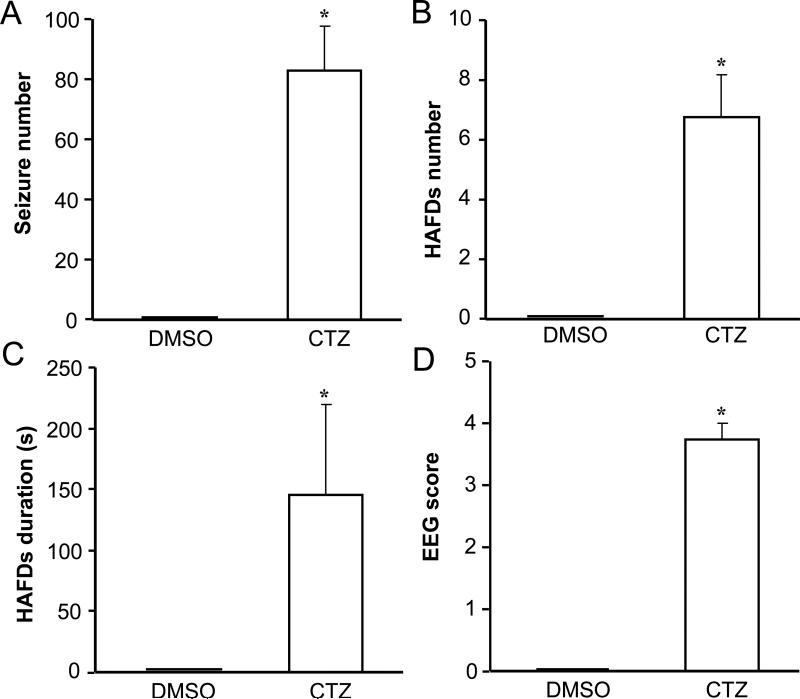
Fig. 5. Typical electroencephalographic characteristics of seizures elicited by CTZ.
Bar histograms showing the group data of DMSO control and CTZ-induced (0.75 μmol, n=8) epileptiform EEG components of (A) spontaneous seizure number, (B) HAFDs number, (C) HAFDs duration, (D) EEG score. *P<0.05, **P<0.005 compared to the DMSO control group.

