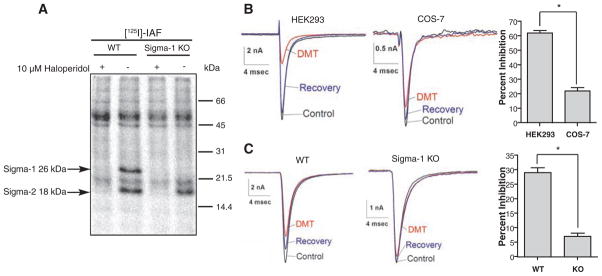
Fig. 3.
Sodium channel inhibition by DMT. (A) In the presence or absence of 10 μM haloperidol, wild type (WT) orsigma-1receptorknock-out (KO) mouse liver homogenates (200 μg/lane) were photolabeled with 1 nM [125I]IAF. (B) Examples of INa evoked by steps from −80 to −10 mV in HEK293 or COS-7 cells expressing hNav1.5 channel in the absence (control, black), presence (DMT, red), and after wash out (recovery, blue) of 100 μM DMT. Average inhibition by DMT was determined by measuring peak INa. Bars represent mean ± SEM (n = 3 cells). INa inhibition in HEK293 cells differed significantly from that in COS-7 cells (*P < 0.03). (C) Examples of INa evoked as described in (B) in neonatal cardiac myocytes from WT and KO mice in the absence (control, black), presence (DMT, red), and after wash out (recovery, blue) of 100 μM DMT. Current inhibition in WT was significantly different from that in KO (*P < 0.002, n = 7 neonatal cardiac myocytes).

