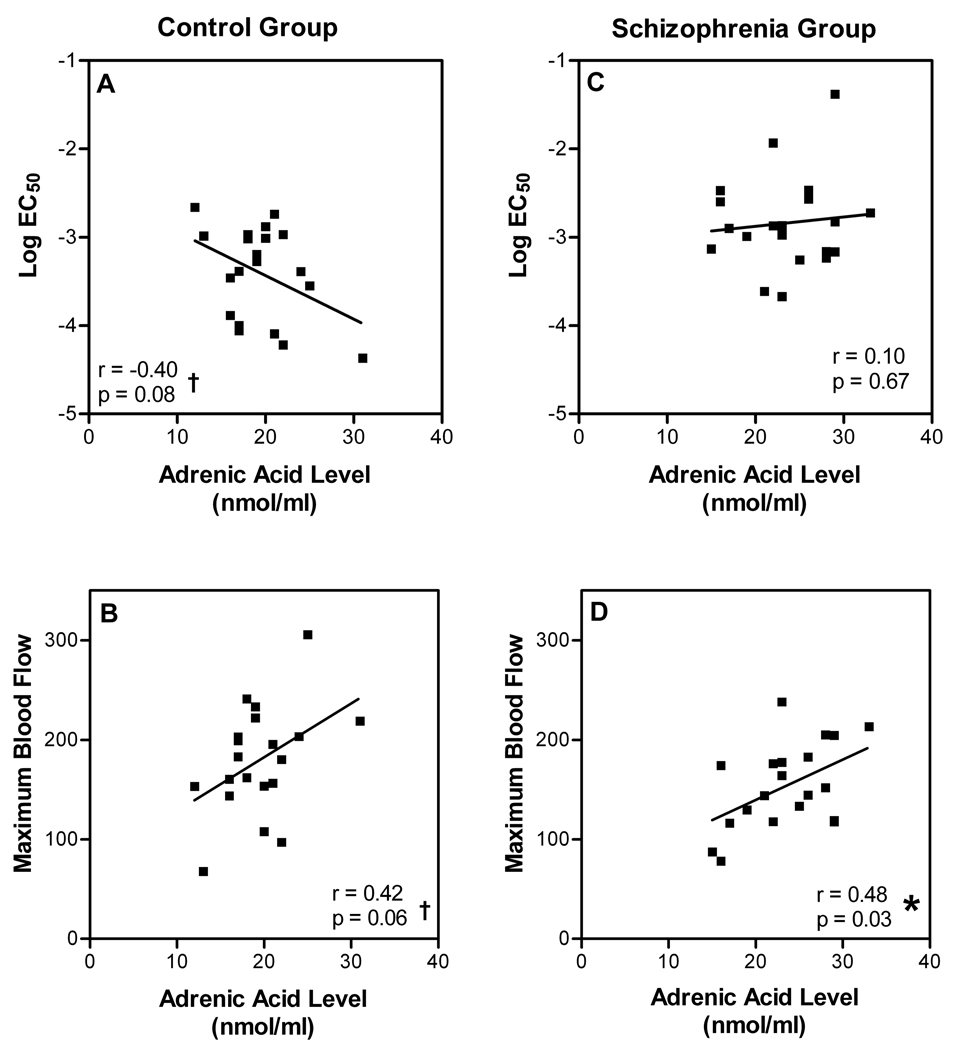
Fig. 6. Relationship between levels of adrenic acid and sensitivity/efficacy of niacin in control and schizophrenia groups.
Individually-derived values of log EC50 and maximal niacin-evoked blood flow response are plotted against RBC membrane levels of adrenic acid for each participant in the control (n=20) and schizophrenia (n=20) groups. Since tests for correlation were exploratory, two-tailed significance tests are not corrected for multiple comparisons.
*Significant correlation.
† Trend-level correlation.

