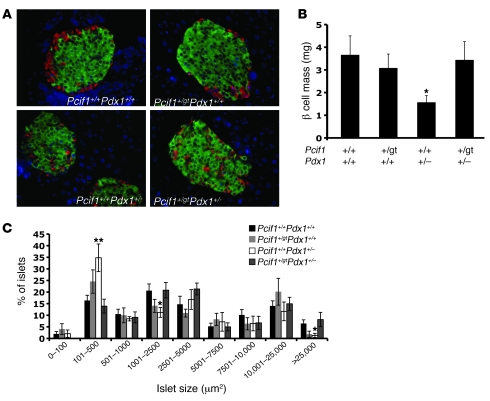
Figure 4. Pcif1 heterozygosity normalizes β cell mass in Pdx1+/– mice.
(A) Representative images of insulin- and glucagon-stained adult pancreas sections. Original magnification ×20. (B) Quantification of β cell mass. n = 7–10 mice per group; *P < 0.05 compared with wild-type. (C) Islet size distribution. n = 7–9 mice per group;*P < 0.05, **P < 0.01 compared with wild-type.

